Kenya lags in logging cause of deaths

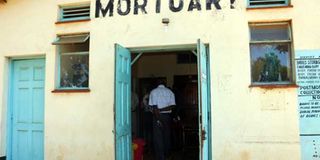
Kenya is one of the countries that do not do complete registration of causes of death. However, the possibility of knowing what kills Kenyans is getting better as the country joins those that record causes of death accurately. PHOTO | FILE
What you need to know:
- A new World Health Organisation report shows that globally, the reporting of the exact cause of death has improved, with causes of almost half of all deaths recorded.
- Of the estimated 56 million deaths recorded globally in 2015, 27 million were registered with a cause of death, according to WHO’s annual World Health Statistics. In 2005, only about a third of deaths had a recorded cause.
- In 2012, 32.5 per cent of Kenyans died due to unsafe water and poor sanitation, ranking Kenya at number 20 among African countries recording similar deaths. The probability of dying of cardiovascular disease, cancer and diabetes between the ages of 30 and 70 in Kenya was 17.8 per cent, in 2015, says the new WHO report.
What are you likely to die of as a Kenyan? Well, that can be rather hard to tell because Kenya is one of the countries that do not do complete registration of causes of death. However, the possibility of knowing what kills Kenyans is getting better as the country joins those that record causes of death accurately.
A new World Health Organisation report shows that globally, the reporting of the exact cause of death has improved, with causes of almost half of all deaths recorded.
“If countries don’t know what makes people sick and die, it is a lot harder to know what to do about it, “said Dr Paule Kieny, the WHO assistant director-general for health systems and innovation. “WHO is working with countries to strengthen health information systems and to enable them to better track progress towards the Sustainable Development Goals,” she added.
Of the estimated 56 million deaths recorded globally in 2015, 27 million were registered with a cause of death, according to WHO’s annual World Health Statistics. In 2005, only about a third of deaths had a recorded cause. Some countries like China, Turkey and Iran have made huge strides, registering up to 90 per cent of deaths in 2015, compared to 5 per cent in 1999.
In 2012, 32.5 per cent of Kenyans died due to unsafe water and poor sanitation, ranking Kenya at number 20 among African countries recording similar deaths. The probability of dying of cardiovascular disease, cancer and diabetes between the ages of 30 and 70 in Kenya was 17.8 per cent, in 2015, says the new WHO report.
QUALITY OF CAUSE
Homicides contributed to 8.2 per cent per 100, 000 people, putting Kenya at number 30 in numbers of recorded homicides in Africa. Suicides in Kenya were at 6.5 per cent per 100, 000 people, whereas the highest suicide rates in Africa occurred in Sierra Leone (30.3 per cent), Cote D’voire (28.4 per cent), South Africa (26.5 per cent) and Equatorial Guinea (22.6 per cent).
Deaths due to natural causes or disasters between 2011 to 2015 were at 0.1 per cent and deaths from major conflicts during the same period stood at 0.6 percent per 100, 000 people. About 2 per cent of Kenyans died from unintentional poisoning in 2015.
Road traffic mortality was estimated at 29.1 per cent in 2013, whereas mortality attributed to household and ambient air pollution was at 60 per cent per 100, 000 people in 2012, putting Kenya at number 34 in Africa.
Average life expectancy in Kenya was put at 55.6 years in 2015, with men having a life expectancy of 61 years and women having a life expectancy of 65.8 years.
Quality of cause of death information is based on certifying deaths based on valid underlying causes of death. When the list of leading causes of death is ill-defined, it affects accurate reporting of cause of death. If too few deaths are registered, or the quality of cause-of-death information is too poor, death registration data cannot be used to reliably monitor mortality by cause.
In Africa, especially, the global health body acknowledges that causes of death listed on death certificates may be incorrect, incomplete or missing. As a result, it makes it difficult to apply data to monitor public health trends. Completeness of cause of death information is defined as the percentage of all deaths in a geographic area that are registered. It is a measure of the reach of the death registration system.
LEADING CAUSES OF DEATH
Poor sanitation – 32.5%
Road accidents – 29.1%
Homicide – 8.2%
Suicide – 6.5%
Unintentional poisoning – 2%
Major conflict – 0.6%
Natural causes/disasters – 0.1%
Life expectancy - 55.6 years
Source: World Health Statistics


