Ethnic imbalance rife in public sector, report shows
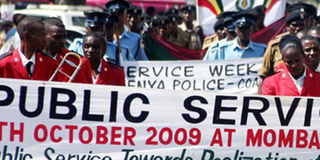
Civil servants in a procession during a past Public Service Week. FILE PHOTO | NATION MEDIA GROUP

What you need to know:
- Kikuyu has the highest representation in public service in the country with 45,401 people, representing 17 percent of the entire workforce in government.
Kenyan-Somalis account for 2.4 million people, but only 4,664 of them work in the public sector.
Kikuyu and Kalenjin ethnic communities are grossly overrepresented in the public service while Kenyan-Somalis are underrepresented, statistics from a survey by the Public Service Commission between 2018 and 2019 show.
The report also shows that Luo and Kisii communities were overrepresented in government offices, while Luhya Mijikenda and Turkana communities are underrepresented in public service.
This report titled ‘‘Status of the Public Service Compliance with the Values and Principles in Articles 10 and 232 of the Constitution (2018/2019)", bases its estimates on the 2009 census report.


With a population of 6.6 million, the Kikuyu has the highest representation in public service in the country with 45,401 people, representing 17 percent of the entire workforce in government.
Kenyan-Somalis account for 2.4 million people, but only 4,664 of them work in the public sector, representing a dismal 6.25 per cent.
The Kalenjin community, with 4.9 million members, follows with 12.9 per cent or 35,541 government employees.
With only 2.2 million members, Kisii ethnic group has a 5.8 per cent (16,235) representation in the public sector.
With four million members, the Luo community enjoys a 10.6 per cent (25,895) representation, closely followed by Kamba (3.9 million) at 10.2 per cent (19,906).
The worst case of underrepresentation features the Turkana community, which has a paltry 1,516 people (2.6 per cent) working in government out of a population of one million.
While it is significantly well represented at 14 per cent, the Luhya community, with a population of 5.3 million, is considered underrepresented in government offices, with only 25,398 members of the ethnic group working in various government offices.
The rest of Kenyan communities, the report shows, are represented within the normal range.
Furthermore, the distribution of new appointments within the public service favours the major tribes, leading with Kikuyu, Kalenjin, Luo and Luhya at 3,399, 2,377, 2,050 and 1,665 in that order.
Again, appointment to higher job groups is dominated by these ethnic groups. Within this period, 156 members of the Kikuyu community were promoted to job groups between R and T.
Additionally, 25 members of the community were elevated to job groups between U and above, the highest in the country.
During the period under review, Sakuye and Dorobo communities had two members each appointed to the public sector.
No member of the Embu, Borana, Burji, and Bajuni was appointed to a job group higher than R.
Similar steep disparities are also observed in training, where the large ethnic groups dominated the training space.
Kikuyu, Kalenjin and Luo communities benefitted the most from training opportunities in the public sector with 9,679, 5,988 and 5,547 officers respectively taking part in such programmes.
Members of Luhya (4,978) and Kamba (3,755) also registered high numbers of training beneficiaries in the public sector.
No member of the Ilchamus, Nubi, Orma, Rendille and Pokomo benefitted from training services in the stated period. Others who were not trained are Taita, Teso and Tharaka.
The report highlights worrying inequalities in the public service even as the government moves to attain balance in ethnic and regional balance in its workforce.
However, the government hopes to minimise the disparities in the next three years by deliberately appointing to its departments, commissions and state agencies members of the communities that are underrepresented in the public sector.
Some of the areas targeted for improvement include constitution commissions and independent offices (247), ministries and state departments (1,382), public universities (1,097) and state corporations (4,183).